ImmuCC User Manual
Comprehensive guide for using ImmuCC web server to analyze both bulk RNA-seq and single-cell RNA-seq data for immune cell composition estimation.
Overview
The ImmuCC web server provides two complementary tools for immune cell composition analysis:
- ImmuCC: Estimates relative immune cell compositions in mouse tissue from bulk transcriptomal data (microarray and RNA-Seq)
- sc-ImmuCC: Performs hierarchical immune cell type annotation for single-cell RNA-seq data with three classification layers
Bulk RNA-seq Analysis (ImmuCC)
-
Parameter selection
- Platform
- Method
The ImmuCC web server can be applied to different types of transcriptomal data profiled on microarray or RNA-Seq (Illumina) technology. The microarray platform further involves Affymetric mouse 430 2.0, Illumina MouseWG-6 v2.0 expression beadchip and Agilent Whole Mouse Genome Microarray 4x44K v2. Users should exactly choose the suited platform according to their experiments.
Two machine-learning methods, support vector regression (SVR) and linear least square regression (LLSR), can be freely selected to infer the tissue immune cell compositions. The performance evaluation of these two methods will be shown in our reference paper.
-
Transcriptomal data
Figure 1 gives an example of the input file for transcriptomal data profiled on RNA-Seq. Each column denotes an expression profile of a single sample and each row label corresponds to a particular gene. Users should note that the gene name of microarray data is Entrez IDs, while the gene name of RNASeq data is Ensemble gene IDs. An example of transcriptome data can be downloaded here .
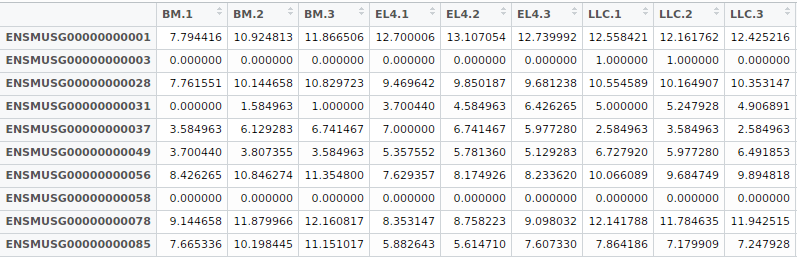
Figure 1: The input format of the transcriptomal data.
-
Pre-processing method for raw data
How to gain the standard input of ImmuCC for microarray or RNA-Seq data? The different platforms have the different pipelines.
- Microarray data pre-processing pipeline
- RNA-Seq data pre-processing pipeline
The raw microarray files are Affy CEL files, Agilent TXT files, etc. A guide for pre-processing these raw data to meet the rule of ImmuCC input format was described in Github .
The raw RNA-Seq data is fastq format. A script for pre-processing the raw data to input format can be downloaded here and Github
Results Interpretation
After users have submitted their jobs, a confirmation email will be sent to their email box. The ImmuCC will take a few minutes to predict the tissue immune cell compositions if there are sample less than 10. Once the job is finished, an auto reminding email with results page URL will also be sent to the user. If users have been patiently waiting for the prediction, the results page of the estimated relative immune cell compositions of tissue samples will be displayed after the job is finished. An example of the results was shown in Figures 2 and 3.
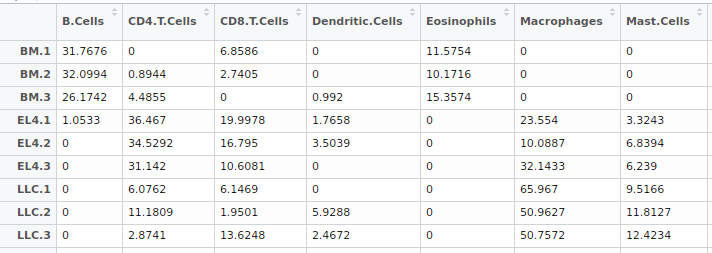
Figure 2: The table of estimated immune cell compositions.
For the result described in the above table 2, each column represents one kind of immune cell type, and each row shows the fractions of immune cell types in this tissue sample. The sum of each row is 100. Here, the inferred immune cell compositions are available for downloading in CSV file format or txt format.
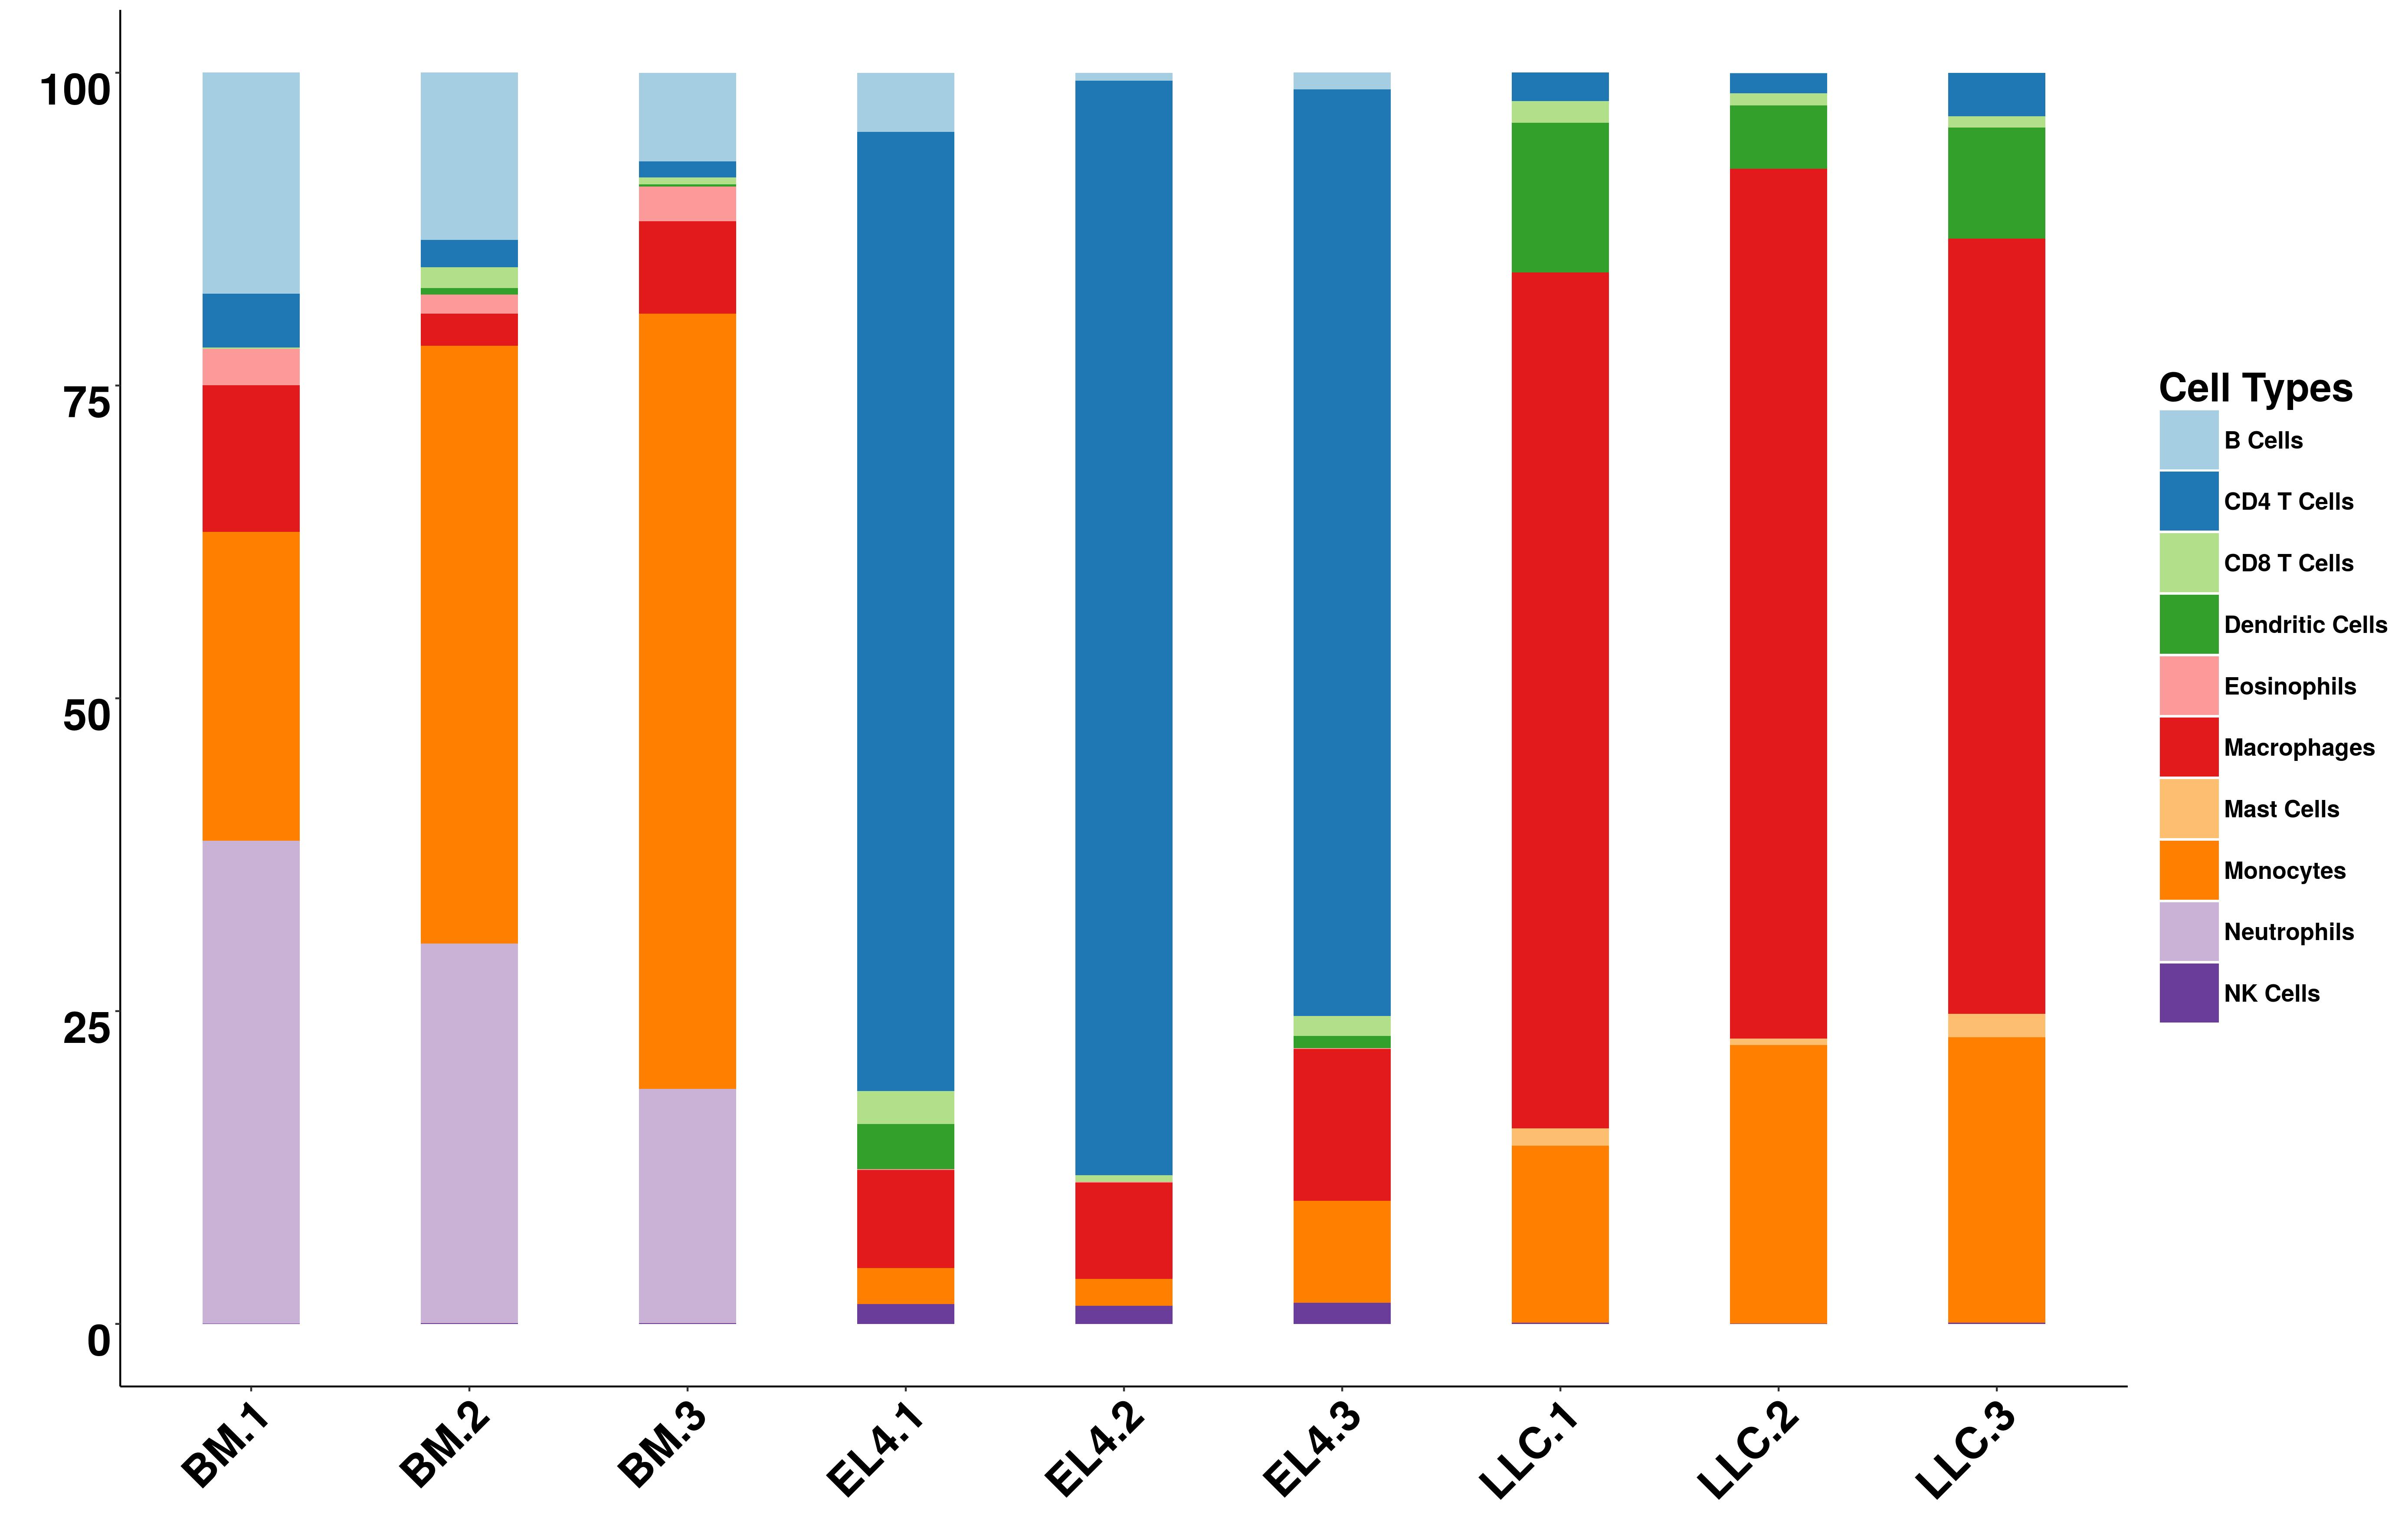
Figure 3: The bar plot of estimated immune cell compositions.
If the number of samples is less than 10, a bar plot will also be provided online. Otherwise, figure for the first 10 samples will be generated. Users can download the figures in pdf or jpg format.
Single-cell RNA-seq Analysis (sc-ImmuCC)
Overview
sc-ImmuCC is a hierarchical layered classification method specifically designed for immune cell type annotation in single-cell RNA-seq data. Unlike traditional clustering methods, sc-ImmuCC provides systematic, reproducible, and biologically meaningful cell type annotations through a three-layer hierarchical structure:
- Layer 1 (L1): Major immune cell lineage classification (e.g., T cells, B cells, Myeloid cells)
- Layer 2 (L2): Refined cell subtype identification (e.g., CD4+ T cells, CD8+ T cells, NK cells)
- Layer 3 (L3): Detailed cell state characterization (e.g., Naive CD4+ T cells, Memory CD8+ T cells)
This hierarchical approach allows researchers to analyze immune cell heterogeneity at different resolution levels and provides comprehensive insights into immune cell compositions and functional states.
Supported File Formats
sc-ImmuCC accepts multiple file formats commonly used in single-cell analysis:
| Format | Extension | Description | Requirements |
|---|---|---|---|
| CSV/TXT | .csv, .txt | Gene expression matrix (genes × cells) | Row names: gene symbols Column names: cell IDs |
| RDS | .rds | R Seurat object | Valid Seurat v3/v4/v5 object |
| H5AD | .h5ad | AnnData object (Python/scanpy) | Standard AnnData format |
| H5Seurat | .h5seurat | Seurat object in HDF5 format | SeuratDisk format |
Important Notes:
- Gene names should be mouse gene symbols (e.g., Cd3e, Cd4, Cd8a)
- For CSV/TXT files: first column contains gene names, first row contains cell IDs
- Recommended: use normalized and log-transformed data
- File size limit: 500MB per upload
Analysis Workflow
Step 1: Data Upload
- Navigate to Single-cell Analysis page
- Enter a descriptive Job Name (optional but recommended)
- Provide your Email to receive notifications (optional)
- Upload your single-cell data file by:
- Clicking the upload area and selecting a file
- Dragging and dropping a file into the upload area
Step 2: Analysis Options
Non-immune Cell Analysis:
- No (Default): Only immune cells will be classified. Non-immune cells will be labeled as "Unassigned"
- Yes: Include prediction for major non-immune cell types (epithelial, endothelial, fibroblasts, etc.)
Tip: Choose "No" if your sample is expected to be purely immune cells (e.g., PBMC, spleen). Choose "Yes" if analyzing tumor tissue or organs with mixed cell populations.
Step 3: Submit and Monitor
- Click "Start Analysis" button
- You will receive a Job ID and be redirected to the results page
- The analysis typically takes 5-15 minutes depending on:
- Number of cells (1,000 - 100,000+)
- File format and size
- Server load
- Progress can be monitored on the results page with real-time log updates
Output Files
Upon successful completion, sc-ImmuCC generates multiple output files organized by analysis type:
1. Classification Results
| File Name | Description | Content |
|---|---|---|
layer1_results.csv |
Layer 1 classifications | Cell ID | Major lineage (8-10 types) |
layer2_results.csv |
Layer 2 classifications | Cell ID | Refined subtype (20-25 types) |
layer3_results.csv |
Layer 3 classifications | Cell ID | Detailed cell state (40-50 types) |
all_layers_combined.csv |
Integrated results | Cell ID | L1 | L2 | L3 classifications |
2. Visualizations
Dimensionality Reduction Plots
tsne_layer1.png- t-SNE colored by Layer 1tsne_layer2.png- t-SNE colored by Layer 2tsne_layer3.png- t-SNE colored by Layer 3umap_layer1.png- UMAP colored by Layer 1umap_layer2.png- UMAP colored by Layer 2umap_layer3.png- UMAP colored by Layer 3
Statistical Plots
composition_barplot.png- Cell type proportionsheatmap_marker_genes.png- Marker gene expressiondotplot_top_markers.png- Marker gene dot plot
3. Analysis Log and Metadata
analysis.log- Detailed analysis log with timestampsjob_info.txt- Job parameters and statisticscell_statistics.csv- Per-cell QC metrics
Interpretation Tips:
- Layer 1 provides a high-level overview - useful for understanding major immune compartments
- Layer 2 offers functional insights - suitable for most biological interpretations
- Layer 3 reveals細微differences - ideal for detailed mechanistic studies
- Check
composition_barplot.pngfirst to understand overall cell type distribution - Use t-SNE/UMAP plots to assess classification quality and cell type separation
- Refer to
heatmap_marker_genes.pngto verify marker gene expression patterns
Troubleshooting
- Verify file extension matches actual format
- For CSV/TXT: ensure genes are in rows, cells in columns
- For RDS: verify it's a valid Seurat object using
class(obj) - For H5AD: check with Python:
import scanpy; adata = scanpy.read_h5ad('file.h5ad')
- Non-immune cells: Enable "Non-immune Cell Analysis" option
- Low quality cells: Pre-filter cells with low gene counts (<200 genes)
- Non-mouse data: sc-ImmuCC is trained on mouse data only
- Unusual cell types: Rare or poorly characterized immune subtypes may not be recognized
- < 5,000 cells: 3-5 minutes
- 5,000 - 20,000 cells: 5-10 minutes
- 20,000 - 50,000 cells: 10-15 minutes
- > 50,000 cells: 15-30 minutes
If analysis exceeds 30 minutes, check the log for errors or contact support.
Citations
-
For bulk microarray data analysis, please cite:
Chen Z, Huang A, Sun J, Jiang T, Qin F.X, Wu A. Inference of immune cell composition on the expression profiles of mouse tissue[J]. Scientific reports, 2017, 7: 40508.
-
For bulk RNA-Seq data analysis, please cite:
Chen Z, Quan L, Huang A, Zhao Q, Yuan Y, Yuan X, Shen Q, Shang J, Ben Y, Qin FX-F and Wu A (2018) seq-ImmuCC: Cell-Centric View of Tissue Transcriptome Measuring Cellular Compositions of Immune Microenvironment From Mouse RNA-Seq Data. Front. Immunol. 9:1286. doi: 10.3389/fimmu.2018.01286.
-
For single-cell RNA-seq data analysis, please cite:
Ying Jiang, Ziyi Chen, Na Han, Jingzhe Shang, Aiping Wu. sc-ImmuCC: hierarchical annotation for immune cell types in single-cell RNA-seq. Bioinformatics, 2022, 38(18): 4369-4376. doi: 10.1093/bioinformatics/btac534.